The Fudge Factor – Close v Intraday

QUESTION:
My question below is for Mr. Armstrong.
Hi Mr. Armstrong,
Thank you in behalf of all of the investors/ traders who are awaiting to join Socrates soon . my question is you said in recent blog today ” If we break and close August at least BELOW 15961, then this will open the door to a 5 month correction into October with a maximum decline of about 5000 points” , also said
” you can make a new low in September, not so steep, and rush back to close higher for month-end. This would become possible perhaps with at least a monthly closing below 15961. But a August closing BELOW 15550 would point to a correction into October. “
My understanding is that Aug. 31 closing below 15961 might NOT result in a steep decline into Oct. , only closing below 15500 WILL produce this result .
Am I correct ? Is this the ” fudging ” you mention in the blog ?
Thank you.
R.U.
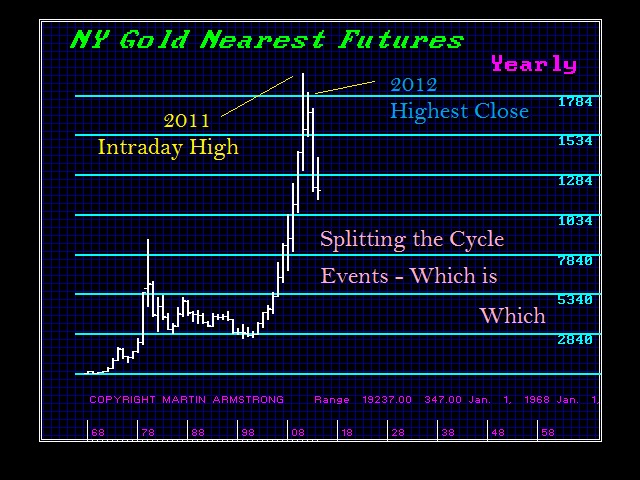
ANSWER: Yes. This is caused by the fact that a cycle can take place on two levels – intraday and closing. For example, gold peaked intraday in 2011, but the highest closing was actually 2012. The two events can be split. This means, a monthly closing below 15550 would tend to warn of a more pronounced decline being prolonged into October. A simple month-end close for August BELOW even 16688 will warn that we could still penetrate the August low, but not necessarily closing lower in September.
This is the questionable “fudge factor” we must take into consideration. But a new low in September and a lower close would point to new lows into October. With this degree of Directional Changes in a row, something extraordinary in itself, this tends to imply a choppy trend that will reduce confidence but there need not be a collapse. The lack of a bounce could build the bearishness.
So these are the potential patterns. We must allow the market to tell us what it is going to do. The key is reading the market. Part of that is the quantitative movement relative to key points on our model. This is what makes the 15550 important. Moving below that we have exceeded the point of support going beyond what existed in 1987 relative to our model.
Dow Today (August 26, 2015) & the Three-Day Bounce
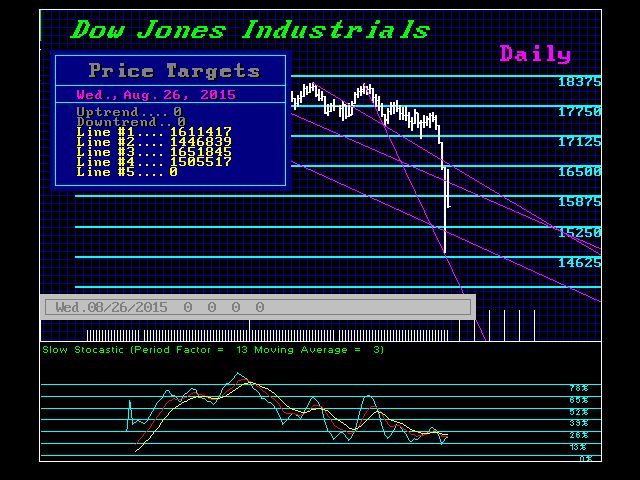
The cycles and oscillators still suggest a three-day bounce into Thursday. We would need a daily closing back above 16461 to suggest that the low will hold at least temporarily. Then we should retest the support. This is where it will become critical going into Monday that we hold this week’s low. If we break and close August at least BELOW 15961, then this will open the door to a five-month correction into October with a maximum decline of about 5000 points from the May high, taking us down into the 12000 zone. Key support will also lie at the 13900 area.
The most alarming event on our model is the string of Directional Changes. This warns that we are not looking at a nice V bottom here. This is why we must define where a FALSE MOVE and a CORRECTION are distinguished. The former is a maximum of three units in time, so that means August. Yes, this can be fudged slightly insofar as you can make a new low in September (not so steep) and rush back to close higher for month-end. This would become possible perhaps with at least a monthly closing below 15961. An August closing BELOW 15550 would point to a correction into October.
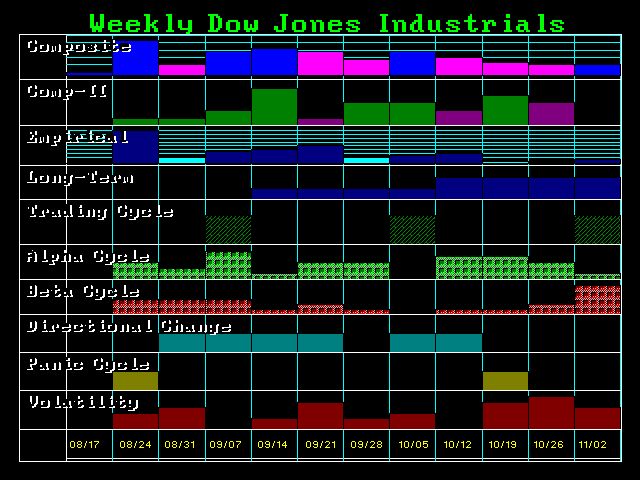
This string of Directional Changes warns of a choppy period ahead, which should chisel confidence down to a mere pebble in any lasting bull market. The interesting aspect is that we did not have a Panic Cycle the week of October 19th until this move. So obviously, the pattern suggested that there is more volatility ahead.
This is HOW we listen to the market. It is NEVER wrong, only people are wrong because we all have opinions that are subjective and reshaped by emotion. That is the danger here.
In conclusion, watch the Dow, for the Dow led on the way up and had led on the way down. This is the BIG MONEY, not retail investors. So we should expect this to turn and provide a clear reference before the NASDAQ or even S&P 500. August holds and we have a classic FALSE MOVE; August gives way in the Dow (not S&P500 or NASDAQ), and we will most likely fall into October turning sentiment very bearish. Then the up move thereafter should be at least a doubling from that low. Ironically, a test of the mid-12000 range would project to the next resistance in the 23000 level as we have warned.
If the government figures out that this is a Sovereign Debt Crisis and actually coordinates an effort to deal with it, ending the hunt for taxes, then the final high could extend into 2023. That is a VERY BIG “IF”.
Socrates to Launch by End of September

We are on schedule for launching Socrates by the end of September. We are setting up the design right now and the dashboard for markets, so you will see the trend at a glance. This requires merging many different models, including the Global Market Watch, which defines the pattern recognition for each time level. Users can easily identify long-term bull and bear markets without having to read anything.
Everyone will be able to sign up directly through the Socrates site. We will also provide videos for you to watch to see what level would be best for you. You will see our famous maps for capital flows for each market around the world with respect to the capital flows into that particular sector and instrument from a global perspective.
This is a global tool. Users will be prompted at sign in to select their base currency for it is pointless to provide forecasting unless it reflects your home currency. Therefore, every instrument will be available to change the charts to reflect the picture from a host of different currency perspectives.
This is quite a different tool overall. This is why we were always the largest and had over $3 trillion under contract back when a trillion use to be real money — about 50% of the total U.S. national debt back then. We are looking to bring the same level of models to every market and share globally. So once you become familiar with how to use the model, you have the same consistent analysis on everything that moves without human interpretation, bias, or emotions.
Thank you for your patience. This is just Phase I. There will be at lot more coming in Phase II.
Please note that it is not possible to sign up for Socrates at this time. Once Socrates is up and running, interested users will have the ability to sign up directly through the Socrates site. Anyone who wishes to join Socrates will have the ability to do so. We are not maintaining a contact list at this time, but will continue to provide updates through our blog as they become available. Once Socrates is ready to launch, we will make a big announcement on our blog that will contain a link to sign up. Additionally, we will have a permanent link on our website that will redirect users to the Socrates site.
Socrates & the IPO – a Lot of E-mails Are Coming In

A lot of e-mails are coming in from people who are asking to join in for the IPO of Socrates. A few companies have now offered to buy in and pay for an accelerated mainframe and staff. We greatly appreciate the support. We will try to launch next year. I do believe that is the only way to protect the technology for the future for as long as they can pretend it is personal property, then they can always make up any excuse to justify some end. So we will do the IPO, but not yet. Lawyers are in the preparation stage and we are entertaining offers of support to accelerate the project. We will let everyone know the progress.
Krugman: Debt is Good & No Bubble in Bonds

Back in May of 2013, Paul Krugman said there was no bubble in bonds. Now he is back saying that debt is good and there is not enough of it. So just what is going on in his head? Of course, the hyperinflationists will point to all sorts of things and predict the end of society is near because of debt. We obviously have a bubble in debt with interest rates on the near-term negative. So what planet is Krugman really on?
Ironically, he is correct in a limited sense. There is not enough Federal U.S. debt to satisfy the world. But that does not translate into debt being good. The shortage in U.S. debt has materialized from two primary causes: (1) the Fed buying in debt, and (2) the lack of trust in debt of other countries, no less at the State and municipal levels. So it is not that debt is good or that the answer is to create more debt. What is going on is a shift in debt portfolios due to risk that has been concentrating capital in U.S. Federal debt. In that sense, correct, there is not enough Federal debt to replace all other levels of debt outstanding. It is kind of like stock, for example if some company invents a new drug everyone will jump on that one share and may sell other shares to buy the hot one.
There is no question about it — we are in a debt bubble. But this is part of the crisis. Government debt has been perceived as “safe” so it has sucked in capital from the private sector. This has reduced investment that creates jobs and we see this trend fueling the rise in unemployment among the youth because governments are competing for capital that should be expanding the economy. This is all part of the crisis we face; we are one trend behind this shift on the horizon from public back to private.
The last Sovereign Debt Crisis at the national government level was in 1931. Hello world! It’s time again very soon. The implosion in equities is helping to create that bond bubble. Welcome to the final collapse of Marxism.
The Markets From Asia & the Prospects for the Dow

Asian shares are still struggling on Wednesday as it begins to dawn on investors that the Chinese economy really is slowing. The implication for that is more deflation in commodities as they have accounted for nearly 50% of the purchases of commodities these past few years. As with respect to world total GDP, China has also accounted for nearly 50% of all growth, making up for the dismal growth in Europe.
Investors are starting to fear that even fresh rate cuts in China will not be enough to stabilize its slowing economy and thus, stem the tide of the collapse in Chinese share prices. As we stated, the charts are different in the Shanghai index, warning that new lows are clearly on the horizon.
Much as the decline in Japan unfolds, every attempt to rally saw China’s key share indexes smacked back down by waves of selling. This illustrates the overall investors’ view that support that is far more aggressive is needed from the government and the central bank to hold the market. If China is wise, they will not follow the route of Japan. The sooner the bloodletting is allowed to unfold, the sooner the trend will conclude.
In the USA, we still see Monday’s low as critical, as well as this week. A breach of this week’s low warns of a maximum decline of about 5000 points from the May high on the Dow, so that would bring us into the 12000 zone. The critical number that we will have to watch for on the closing of the month on the 31st will be 15550. If we close below that level, this will warn that indeed we may be looking at an October low.
Additionally, critical support for the Dow (big money) lies at 15961. If we close beneath that level, this too will warn that support below is starting to yield and a steeper decline is likely down to the 13900 area. We see about a 2000 point gap, but we do NOT expect that to occur in a couple of days. It would most likely become the target for an extended decline into October, with the extreme target in the mid 12000 zone.
No comments:
Post a Comment